
If a loom produces the same flaw shift after shift, the mill may have a full logbook and still struggle to reduce waste. Someone has to work out which loom is involved, when the defect recurs, and who will follow up. That practical question is at the heart of Does Management Matter? Evidence from India, by Nicholas Bloom, Benn Eifert, Aprajit Mahajan, David McKenzie, and John Roberts. Published study
The researchers randomly assigned textile firms to groups and gave selected mills help putting new routines into practice. The 2013 paper in The Quarterly Journal of Economics reports that productivity rose by about 17% in the first year, with gains tied to better quality, more efficient production, and lower inventory. The estimate comes from a specific set of mills, and its meaning depends on what each group received. 2013 journal article
What did the researchers compare?
The study covered 28 plants operated by 17 cotton-weaving firms around Mumbai. Random assignment began at the firm level, followed by selection of individual plants. Twenty plants entered the direct comparison. Fourteen plants across 11 firms received implementation support, and six plants across six firms served as controls. The other eight were outside the direct comparison. Researchers tracked their practices, and those plants received no consulting directly. Experimental design, Section III
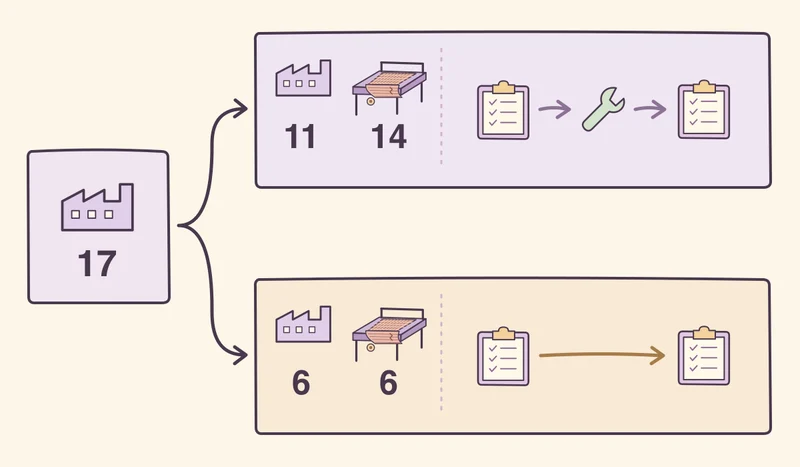
The consultants set up data collection and offered recommendations in both groups. They then worked with the treatment plants to put the recommendations into practice, coach managers, and adapt the routines to the factory floor. Both groups continued to receive light advice during follow-up. The comparison captures the effect of adding hands-on implementation to the diagnosis both groups received. Consulting intervention, Section III
What changed on the factory floor?
The researchers tracked 38 defined practices across production, quality, inventory, targets, and people management. Before the intervention, 93% of the treatment plants recorded defects. Only 29% tracked them daily or by type, and none had a standard way to analyze the data and act on it. Consultants helped plants classify defects by type and severity and coached managers to use production and quality figures in daily meetings. Practices and implementation, Section III and Appendix Table A.I.
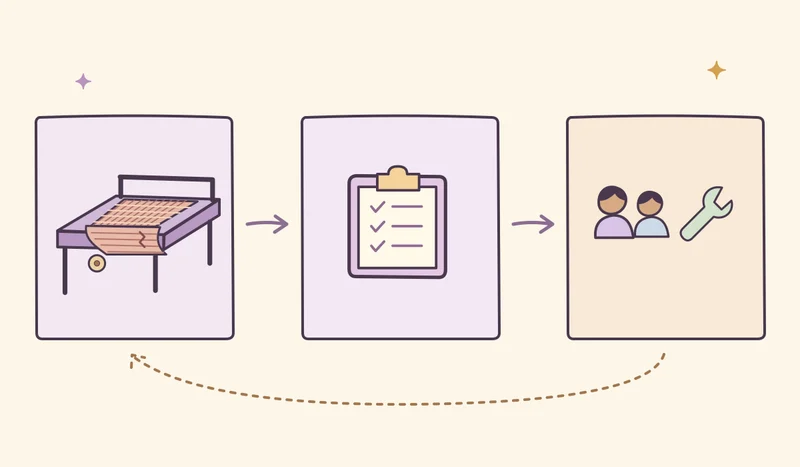
For inventory, mills cataloged their yarn and found stock they had been carrying. They sold some of it or used it in new designs, then introduced replenishment rules and checked them weekly. Mills also started routine loom maintenance and tracked breakdowns. The quality gains appeared earlier than inventory reductions, since clearing old stock and changing purchasing took time. Outcomes and mechanisms, Section IV
How should we read the 11% and 17% estimates?
The January 2011 NBER working paper that prompted this article reported an 11% productivity gain in its abstract. The published 2013 paper reports about 17% in the first year and gives a 16.6% estimate for total factor productivity in its discussion. I use the journal article for the detailed results below. The two figures belong to different versions of the same study. NBER Working Paper 16658 · Published paper, Table II
| Outcome | Estimated change after implementation |
|---|---|
| Severity-weighted defect index | Down about 43% |
| Yarn inventory | Down 21.7% |
| Output | Up 9.4% |
| Total factor productivity (TFP) | Up 16.6% |
TFP estimates how output changes after accounting for the inputs used to produce it. The amount of cloth woven is a separate measure, as are the other rows in the table. The researchers inferred profit changes from improvements in quality, inventory, and efficiency because they could not obtain plant-level profit-and-loss records. Table II and profit estimates, Section IV
Why hadn’t the mills already adopted these practices?
Interviews and patterns of adoption led the authors to point to information barriers. Some owners had never heard of particular practices. Others knew of them and doubted they would work at their own mills. Once owners could check the operating data, they had a way to delegate more decisions to plant managers. The researchers also found signs that firms later opened more plants, though the evidence on expansion was less certain than the first-year production results. Delegation and barriers to adoption, Sections V–VI
The study used random assignment, with 17 firms in one industry and region. The intervention bundled multiple practices and required substantial consultant time. The experiment estimates the effect of that package in its setting. The effect of a single practice or of the package in another industry would need its own evidence. A follow-up nine years later found that the treated plants had dropped about half the practices they had adopted, while a gap in practices between the groups persisted. Published study, Sections III and VII · Long-term follow-up
How I’d apply the lesson to an ERP project
Imagine a CEO sees a stockout report every week, but the warehouse manager still has to call for permission whenever something needs replenishing. I’d start with one product category. Have the ERP bring together verified stock on hand, open purchase orders, and reservations. Then agree on reorder points and a limit within which the warehouse manager can approve replenishment. Send purchases above the limit and exceptions in the data to the person authorized to review them.
Before the trial, record how often items run out, how often the team has to place rush orders, and how much inventory it carries. Watch all three measures after changing the routine. If stockouts decline and inventory rises sharply, the team can revisit the reorder points against actual demand. This is a hypothetical application of the study to ERP workflow and measurement. Results would depend on the company’s data, decision rules, and how the team uses them.
Before adding another report, pick one recurring problem. Who sees it in time, who can act, and what measure would show it’s happening less often? Those answers give the report a job to do.